
Today I wanted to improve the performance of my solver-of-squares-rs project. I needed to find a profiler for my application. After doing a little research, I settled on using two different tools: flamegraph and samply.
Flamegraph
Flamegraph profiles your application and, perhaps unsuprisingly, produces a flamegraph as an SVG. If you open the SVG and place your mouse cursor on one of the blocks, you will see additional information appear at the bottom of the image, including the full function name, the sample count, and the percentage. It also has a very faint search box in the upper-right corner. This tool particularly useful for generating flamegraphs that you can share with others. You can run it using the following command:
CARGO_PROFILE_RELEASE_DEBUG=true cargo flamegraph --root -- ./my/app/arguments
I prefer to use the CARGO_PROFILE_RELEASE_DEBUG environment variable instead of changing the release profile in the cargo file unless I plan on shipping debug symbols into my production environment. Using the environment variable is less invasive, and it is something I do not have to remember to disable later.
Using --root is necessary when running on macOS. If you do not use it you will get dtrace errors like the following:
dtrace: system integrity protection is on, some features will not be available
dtrace: failed to initialize dtrace: DTrace requires additional privileges
failed to sample program
Here is an example output. If you want to interact with it, click the image to open it in a new tab.

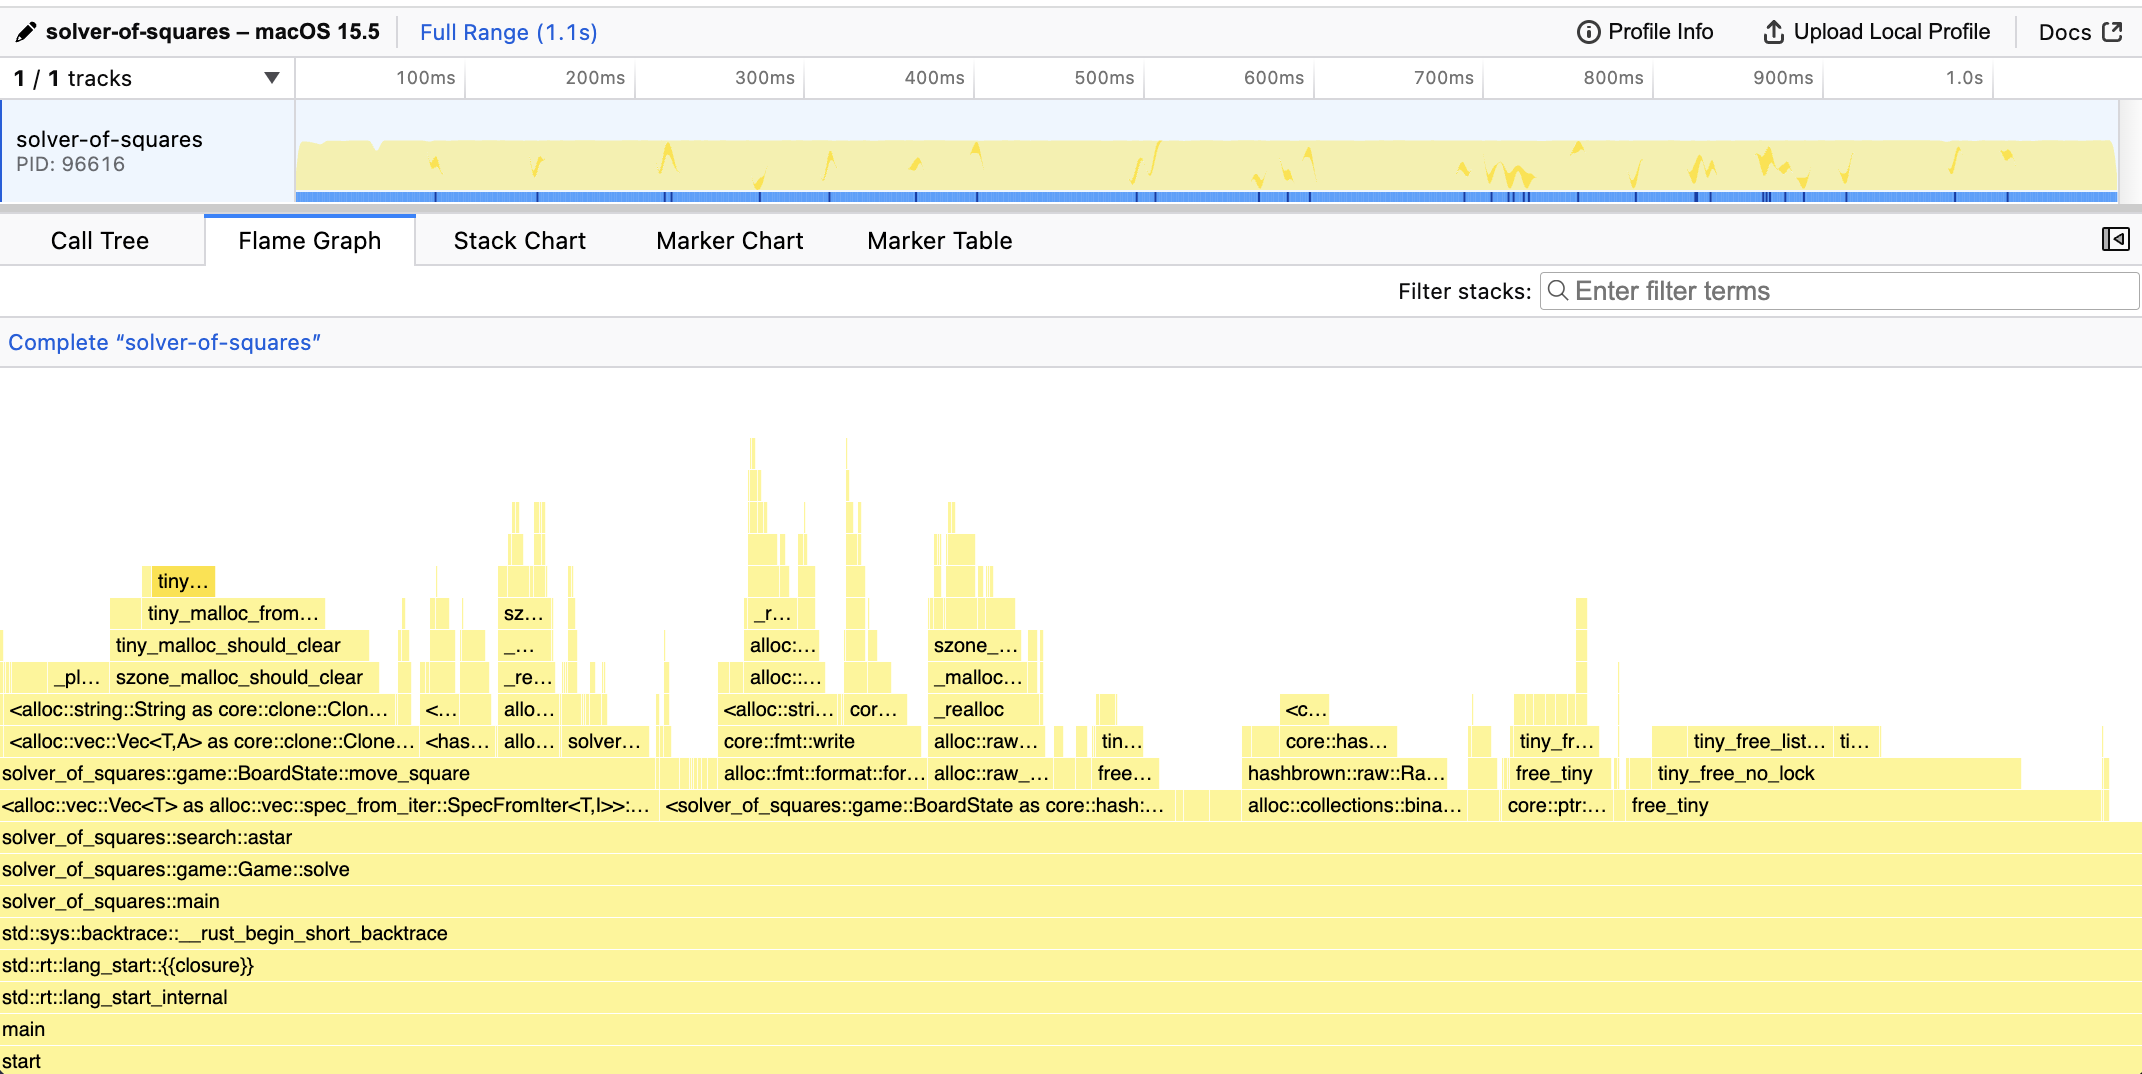
Samply
Samply is another profiler that uses the Firefox profiler as its UI. This has a better developer experience while working on the code, but it is less convenient to share with others. While I use flamegraph with cargo, I run samply against the release target directly. You can run it using the following command:
samply record ./target/release/my-app ./my/app/arguments
When the program exits, samply will open a browser and display the flamegraph. You can also view CPU history, a call tree, and a stack chart. Unfortunately the profile will not open in Safari (my preferred browser), so you will need to open it in Firefox or a Chromium-based browser.
Both flamegraph and samply are fantastic tools and I will continue to use both of them.